|
Download Data (XLS File) |
|
|||||
|
|||||
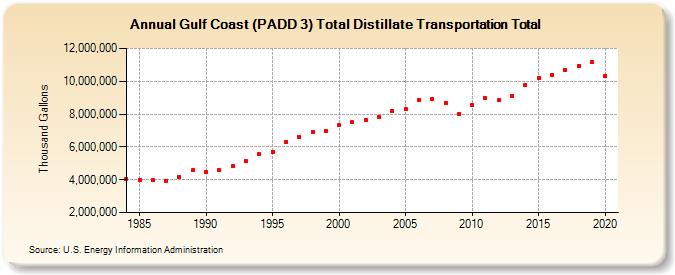
| Gulf Coast (PADD 3) Total Distillate Transportation Total (Thousand Gallons) | |||||
| Decade | Year-0 | Year-1 | Year-2 | Year-3 | Year-4 | Year-5 | Year-6 | Year-7 | Year-8 | Year-9 |
|---|---|---|---|---|---|---|---|---|---|---|
| 1980's | 4,013,889 | 3,992,373 | 3,979,286 | 3,945,686 | 4,178,886 | 4,587,983 | ||||
| 1990's | 4,487,214 | 4,568,799 | 4,818,398 | 5,134,784 | 5,537,007 | 5,706,441 | 6,290,719 | 6,616,039 | 6,900,310 | 6,965,428 |
| 2000's | 7,311,422 | 7,492,659 | 7,651,535 | 7,840,658 | 8,181,456 | 8,282,342 | 8,882,802 | 8,929,135 | 8,692,610 | 8,011,459 |
| 2010's | 8,531,520 | 8,955,304 | 8,834,892 | 9,123,992 | 9,760,736 | 10,197,442 | 10,406,466 | 10,685,203 | 10,956,066 | 11,159,994 |
| 2020's | 10,334,793 |
| - = No Data Reported; -- = Not Applicable; NA = Not Available; W = Withheld to avoid disclosure of individual company data. |
| Release Date: 2/9/2022 |
| Next Release Date: Suspended |