|
Download Data (XLS File) |
|
|||||
|
|||||
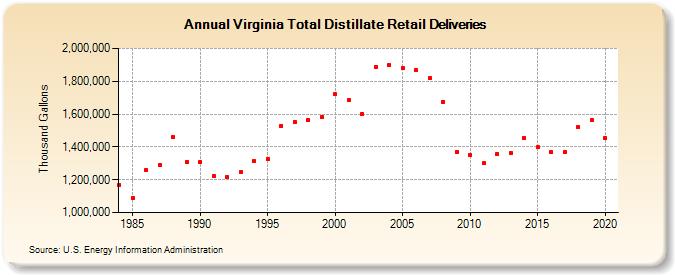
| Virginia Total Distillate Retail Deliveries (Thousand Gallons) | |||||
| Decade | Year-0 | Year-1 | Year-2 | Year-3 | Year-4 | Year-5 | Year-6 | Year-7 | Year-8 | Year-9 |
|---|---|---|---|---|---|---|---|---|---|---|
| 1980's | 1,168,008 | 1,091,350 | 1,259,786 | 1,292,536 | 1,459,236 | 1,307,754 | ||||
| 1990's | 1,308,437 | 1,223,897 | 1,214,165 | 1,246,519 | 1,314,274 | 1,327,628 | 1,529,269 | 1,551,657 | 1,564,514 | 1,580,557 |
| 2000's | 1,720,085 | 1,684,272 | 1,601,735 | 1,889,413 | 1,899,634 | 1,880,164 | 1,866,605 | 1,818,600 | 1,673,305 | 1,371,715 |
| 2010's | 1,351,578 | 1,299,064 | 1,357,278 | 1,362,989 | 1,455,740 | 1,396,861 | 1,369,350 | 1,367,737 | 1,521,519 | 1,564,854 |
| 2020's | 1,455,281 |
| - = No Data Reported; -- = Not Applicable; NA = Not Available; W = Withheld to avoid disclosure of individual company data. |
| Release Date: 2/9/2022 |
| Next Release Date: Suspended |