|
Download Data (XLS File) |
|
|||||
|
|||||
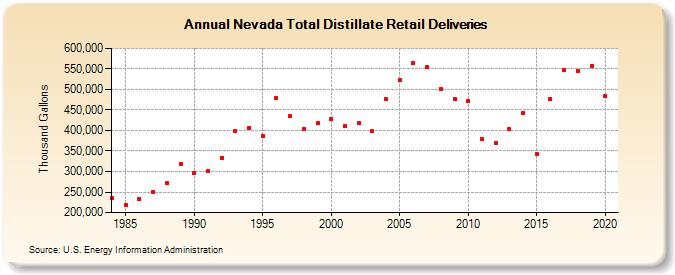
| Nevada Total Distillate Retail Deliveries (Thousand Gallons) | |||||
| Decade | Year-0 | Year-1 | Year-2 | Year-3 | Year-4 | Year-5 | Year-6 | Year-7 | Year-8 | Year-9 |
|---|---|---|---|---|---|---|---|---|---|---|
| 1980's | 234,513 | 218,366 | 233,812 | 250,218 | 272,814 | 319,239 | ||||
| 1990's | 295,441 | 301,666 | 334,001 | 397,546 | 407,030 | 386,778 | 479,765 | 434,158 | 404,224 | 417,762 |
| 2000's | 427,746 | 410,400 | 418,256 | 399,492 | 477,157 | 522,775 | 565,572 | 553,932 | 501,708 | 477,649 |
| 2010's | 471,490 | 380,246 | 368,665 | 403,505 | 443,653 | 343,231 | 476,956 | 547,558 | 544,795 | 557,267 |
| 2020's | 482,950 |
| - = No Data Reported; -- = Not Applicable; NA = Not Available; W = Withheld to avoid disclosure of individual company data. |
| Release Date: 2/9/2022 |
| Next Release Date: Suspended |