|
Download Data (XLS File) |
|
|||||
|
|||||
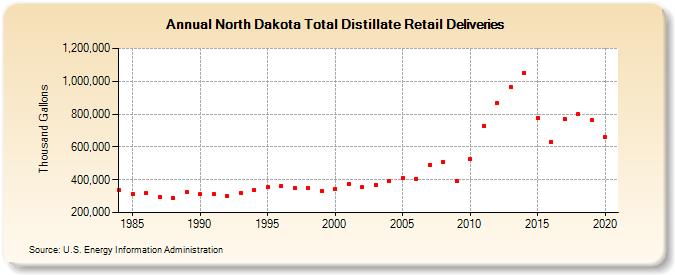
| North Dakota Total Distillate Retail Deliveries (Thousand Gallons) | |||||
| Decade | Year-0 | Year-1 | Year-2 | Year-3 | Year-4 | Year-5 | Year-6 | Year-7 | Year-8 | Year-9 |
|---|---|---|---|---|---|---|---|---|---|---|
| 1980's | 336,250 | 313,651 | 319,889 | 295,109 | 289,388 | 328,260 | ||||
| 1990's | 312,696 | 312,290 | 299,822 | 320,760 | 338,131 | 353,124 | 360,800 | 348,314 | 346,648 | 333,602 |
| 2000's | 341,482 | 376,672 | 353,146 | 367,938 | 393,793 | 410,836 | 406,425 | 491,537 | 509,968 | 395,030 |
| 2010's | 524,765 | 728,574 | 866,387 | 963,512 | 1,052,488 | 777,882 | 631,248 | 771,053 | 798,243 | 762,781 |
| 2020's | 657,622 |
| - = No Data Reported; -- = Not Applicable; NA = Not Available; W = Withheld to avoid disclosure of individual company data. |
| Release Date: 2/9/2022 |
| Next Release Date: Suspended |