|
Download Data (XLS File) |
|
|||||
|
|||||
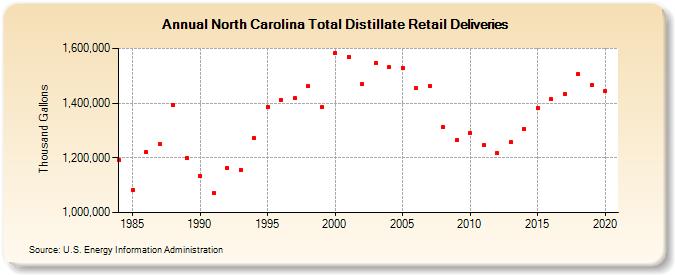
| North Carolina Total Distillate Retail Deliveries (Thousand Gallons) | |||||
| Decade | Year-0 | Year-1 | Year-2 | Year-3 | Year-4 | Year-5 | Year-6 | Year-7 | Year-8 | Year-9 |
|---|---|---|---|---|---|---|---|---|---|---|
| 1980's | 1,190,354 | 1,082,866 | 1,220,064 | 1,249,059 | 1,393,036 | 1,200,013 | ||||
| 1990's | 1,133,948 | 1,070,875 | 1,163,044 | 1,157,353 | 1,272,391 | 1,385,389 | 1,413,037 | 1,417,539 | 1,461,010 | 1,385,146 |
| 2000's | 1,584,039 | 1,570,186 | 1,468,723 | 1,546,144 | 1,530,900 | 1,529,655 | 1,453,608 | 1,464,166 | 1,311,640 | 1,264,120 |
| 2010's | 1,290,771 | 1,245,127 | 1,216,073 | 1,256,917 | 1,306,322 | 1,382,585 | 1,414,031 | 1,432,264 | 1,506,506 | 1,465,159 |
| 2020's | 1,443,055 |
| - = No Data Reported; -- = Not Applicable; NA = Not Available; W = Withheld to avoid disclosure of individual company data. |
| Release Date: 2/9/2022 |
| Next Release Date: Suspended |