|
Download Data (XLS File) |
|
|||||
|
|||||
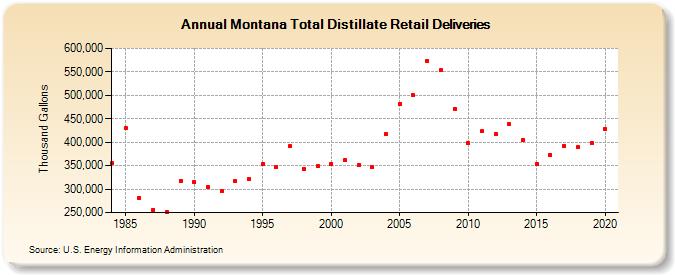
| Montana Total Distillate Retail Deliveries (Thousand Gallons) | |||||
| Decade | Year-0 | Year-1 | Year-2 | Year-3 | Year-4 | Year-5 | Year-6 | Year-7 | Year-8 | Year-9 |
|---|---|---|---|---|---|---|---|---|---|---|
| 1980's | 355,045 | 430,059 | 280,863 | 256,091 | 251,770 | 318,045 | ||||
| 1990's | 314,738 | 305,464 | 294,967 | 316,762 | 322,123 | 353,010 | 348,174 | 391,019 | 343,578 | 349,791 |
| 2000's | 353,038 | 361,513 | 350,767 | 346,351 | 417,125 | 481,761 | 499,689 | 573,264 | 553,085 | 470,498 |
| 2010's | 398,775 | 422,845 | 417,456 | 438,267 | 404,472 | 353,312 | 372,802 | 392,135 | 389,436 | 399,293 |
| 2020's | 427,871 |
| - = No Data Reported; -- = Not Applicable; NA = Not Available; W = Withheld to avoid disclosure of individual company data. |
| Release Date: 2/9/2022 |
| Next Release Date: Suspended |