|
Download Data (XLS File) |
|
|||||
|
|||||
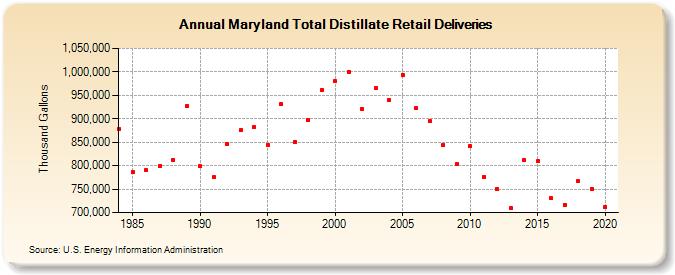
| Maryland Total Distillate Retail Deliveries (Thousand Gallons) | |||||
| Decade | Year-0 | Year-1 | Year-2 | Year-3 | Year-4 | Year-5 | Year-6 | Year-7 | Year-8 | Year-9 |
|---|---|---|---|---|---|---|---|---|---|---|
| 1980's | 878,244 | 786,447 | 789,849 | 799,174 | 812,606 | 926,298 | ||||
| 1990's | 798,640 | 775,120 | 845,887 | 875,494 | 882,123 | 844,141 | 930,794 | 850,718 | 897,453 | 961,385 |
| 2000's | 979,957 | 1,000,600 | 921,074 | 965,095 | 939,456 | 993,270 | 922,376 | 894,416 | 843,750 | 802,540 |
| 2010's | 841,818 | 776,640 | 750,065 | 709,174 | 811,425 | 809,095 | 730,852 | 716,676 | 766,741 | 750,769 |
| 2020's | 712,619 |
| - = No Data Reported; -- = Not Applicable; NA = Not Available; W = Withheld to avoid disclosure of individual company data. |
| Release Date: 2/9/2022 |
| Next Release Date: Suspended |