|
Download Data (XLS File) |
|
|||||
|
|||||
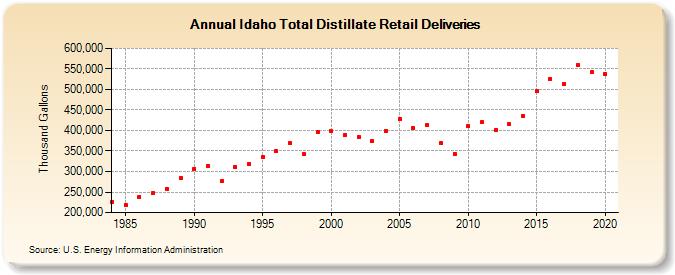
| Idaho Total Distillate Retail Deliveries (Thousand Gallons) | |||||
| Decade | Year-0 | Year-1 | Year-2 | Year-3 | Year-4 | Year-5 | Year-6 | Year-7 | Year-8 | Year-9 |
|---|---|---|---|---|---|---|---|---|---|---|
| 1980's | 226,876 | 217,837 | 238,530 | 248,339 | 257,514 | 284,182 | ||||
| 1990's | 306,746 | 314,470 | 276,537 | 311,057 | 317,822 | 334,535 | 349,041 | 368,876 | 343,129 | 395,826 |
| 2000's | 397,597 | 388,926 | 384,189 | 374,106 | 399,836 | 428,022 | 406,533 | 413,091 | 369,358 | 343,889 |
| 2010's | 411,304 | 419,742 | 400,504 | 414,927 | 435,990 | 495,019 | 525,871 | 514,429 | 559,796 | 541,621 |
| 2020's | 538,189 |
| - = No Data Reported; -- = Not Applicable; NA = Not Available; W = Withheld to avoid disclosure of individual company data. |
| Release Date: 2/9/2022 |
| Next Release Date: Suspended |