|
Download Data (XLS File) |
|
|||||
|
|||||
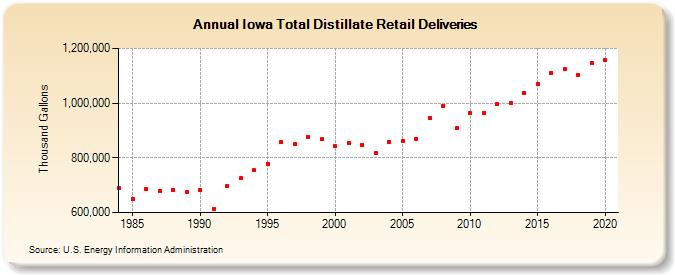
| Iowa Total Distillate Retail Deliveries (Thousand Gallons) | |||||
| Decade | Year-0 | Year-1 | Year-2 | Year-3 | Year-4 | Year-5 | Year-6 | Year-7 | Year-8 | Year-9 |
|---|---|---|---|---|---|---|---|---|---|---|
| 1980's | 688,041 | 649,422 | 685,534 | 680,546 | 683,668 | 676,545 | ||||
| 1990's | 682,940 | 613,014 | 695,885 | 725,237 | 754,453 | 779,188 | 856,619 | 848,867 | 876,313 | 867,048 |
| 2000's | 842,497 | 853,767 | 848,303 | 816,948 | 857,074 | 862,524 | 870,428 | 945,366 | 988,531 | 907,248 |
| 2010's | 962,378 | 965,403 | 995,071 | 1,000,424 | 1,038,720 | 1,071,016 | 1,111,111 | 1,124,153 | 1,104,075 | 1,148,316 |
| 2020's | 1,156,591 |
| - = No Data Reported; -- = Not Applicable; NA = Not Available; W = Withheld to avoid disclosure of individual company data. |
| Release Date: 2/9/2022 |
| Next Release Date: Suspended |