|
Download Data (XLS File) |
|
|||||
|
|||||
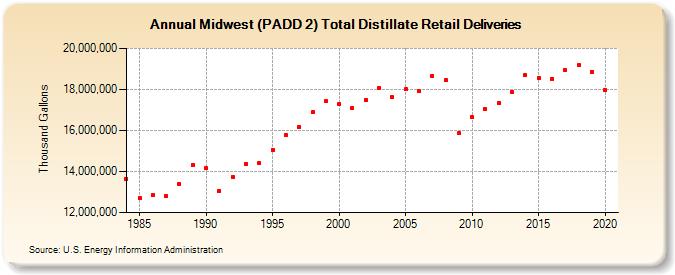
| Midwest (PADD 2) Total Distillate Retail Deliveries (Thousand Gallons) | |||||
| Decade | Year-0 | Year-1 | Year-2 | Year-3 | Year-4 | Year-5 | Year-6 | Year-7 | Year-8 | Year-9 |
|---|---|---|---|---|---|---|---|---|---|---|
| 1980's | 13,649,381 | 12,712,223 | 12,859,136 | 12,793,250 | 13,392,376 | 14,318,165 | ||||
| 1990's | 14,152,329 | 13,069,848 | 13,746,069 | 14,380,264 | 14,421,528 | 15,054,198 | 15,771,771 | 16,173,836 | 16,885,433 | 17,421,548 |
| 2000's | 17,278,885 | 17,088,096 | 17,494,005 | 18,091,831 | 17,615,877 | 17,999,545 | 17,905,457 | 18,656,841 | 18,438,811 | 15,855,565 |
| 2010's | 16,643,687 | 17,037,090 | 17,346,040 | 17,873,033 | 18,697,610 | 18,579,847 | 18,527,529 | 18,923,184 | 19,168,758 | 18,865,848 |
| 2020's | 17,963,948 |
| - = No Data Reported; -- = Not Applicable; NA = Not Available; W = Withheld to avoid disclosure of individual company data. |
| Release Date: 2/9/2022 |
| Next Release Date: Suspended |