|
Download Data (XLS File) |
|
|||||
|
|||||
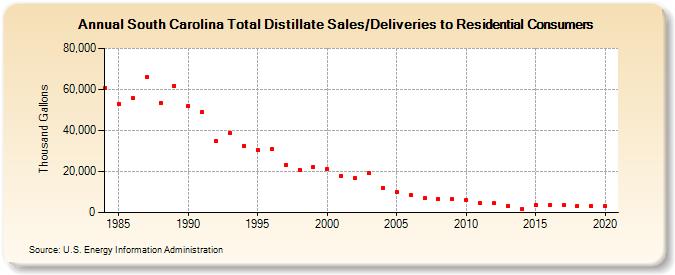
| South Carolina Total Distillate Sales/Deliveries to Residential Consumers (Thousand Gallons) | |||||
| Decade | Year-0 | Year-1 | Year-2 | Year-3 | Year-4 | Year-5 | Year-6 | Year-7 | Year-8 | Year-9 |
|---|---|---|---|---|---|---|---|---|---|---|
| 1980's | 60,601 | 53,044 | 55,614 | 65,943 | 53,464 | 61,869 | ||||
| 1990's | 51,984 | 49,010 | 34,767 | 38,717 | 32,620 | 30,549 | 30,944 | 23,267 | 20,877 | 22,299 |
| 2000's | 21,212 | 17,866 | 16,691 | 19,273 | 12,053 | 10,103 | 8,610 | 7,074 | 6,574 | 6,422 |
| 2010's | 6,015 | 4,435 | 4,495 | 3,201 | 1,707 | 3,709 | 3,623 | 3,488 | 3,194 | 3,094 |
| 2020's | 3,033 |
| - = No Data Reported; -- = Not Applicable; NA = Not Available; W = Withheld to avoid disclosure of individual company data. |
| Release Date: 2/9/2022 |
| Next Release Date: Suspended |