|
Download Data (XLS File) |
|
|||||
|
|||||
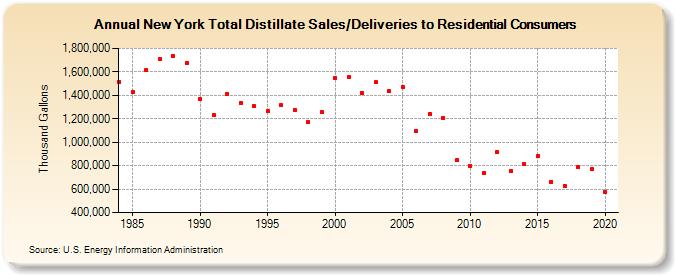
| New York Total Distillate Sales/Deliveries to Residential Consumers (Thousand Gallons) | |||||
| Decade | Year-0 | Year-1 | Year-2 | Year-3 | Year-4 | Year-5 | Year-6 | Year-7 | Year-8 | Year-9 |
|---|---|---|---|---|---|---|---|---|---|---|
| 1980's | 1,517,545 | 1,426,170 | 1,611,838 | 1,705,655 | 1,738,701 | 1,679,326 | ||||
| 1990's | 1,366,014 | 1,228,670 | 1,411,324 | 1,334,617 | 1,306,694 | 1,264,185 | 1,314,434 | 1,277,703 | 1,169,877 | 1,257,211 |
| 2000's | 1,549,169 | 1,555,018 | 1,420,939 | 1,509,847 | 1,435,595 | 1,471,188 | 1,092,698 | 1,241,652 | 1,207,790 | 845,803 |
| 2010's | 800,070 | 739,399 | 912,355 | 756,088 | 810,707 | 881,813 | 663,475 | 630,694 | 788,038 | 771,463 |
| 2020's | 574,470 |
| - = No Data Reported; -- = Not Applicable; NA = Not Available; W = Withheld to avoid disclosure of individual company data. |
| Release Date: 2/9/2022 |
| Next Release Date: Suspended |