|
Download Data (XLS File) |
|
|||||
|
|||||
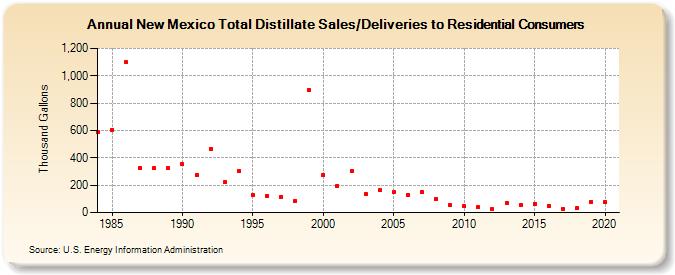
| New Mexico Total Distillate Sales/Deliveries to Residential Consumers (Thousand Gallons) | |||||
| Decade | Year-0 | Year-1 | Year-2 | Year-3 | Year-4 | Year-5 | Year-6 | Year-7 | Year-8 | Year-9 |
|---|---|---|---|---|---|---|---|---|---|---|
| 1980's | 588 | 607 | 1,098 | 327 | 324 | 323 | ||||
| 1990's | 354 | 273 | 468 | 223 | 305 | 127 | 122 | 116 | 87 | 895 |
| 2000's | 274 | 194 | 302 | 135 | 162 | 149 | 127 | 150 | 99 | 55 |
| 2010's | 46 | 37 | 27 | 72 | 53 | 66 | 48 | 27 | 32 | 79 |
| 2020's | 76 |
| - = No Data Reported; -- = Not Applicable; NA = Not Available; W = Withheld to avoid disclosure of individual company data. |
| Release Date: 2/9/2022 |
| Next Release Date: Suspended |