|
Download Data (XLS File) |
|
|||||
|
|||||
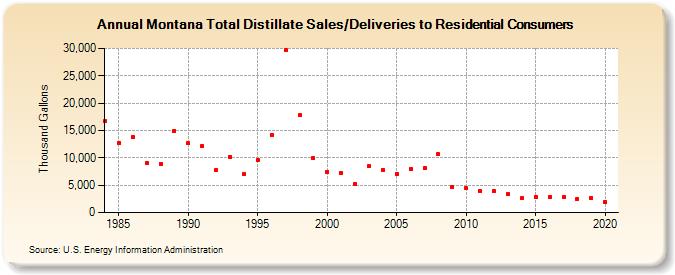
| Montana Total Distillate Sales/Deliveries to Residential Consumers (Thousand Gallons) | |||||
| Decade | Year-0 | Year-1 | Year-2 | Year-3 | Year-4 | Year-5 | Year-6 | Year-7 | Year-8 | Year-9 |
|---|---|---|---|---|---|---|---|---|---|---|
| 1980's | 16,686 | 12,747 | 13,807 | 9,071 | 8,896 | 14,991 | ||||
| 1990's | 12,629 | 12,168 | 7,802 | 10,215 | 6,997 | 9,608 | 14,144 | 29,797 | 17,750 | 9,984 |
| 2000's | 7,470 | 7,243 | 5,290 | 8,468 | 7,819 | 7,102 | 8,005 | 8,116 | 10,644 | 4,693 |
| 2010's | 4,400 | 3,969 | 3,878 | 3,309 | 2,611 | 2,924 | 2,880 | 2,880 | 2,483 | 2,684 |
| 2020's | 1,994 |
| - = No Data Reported; -- = Not Applicable; NA = Not Available; W = Withheld to avoid disclosure of individual company data. |
| Release Date: 2/9/2022 |
| Next Release Date: Suspended |