|
Download Data (XLS File) |
|
|||||
|
|||||
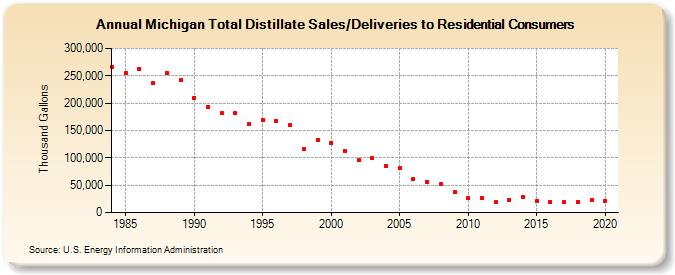
| Michigan Total Distillate Sales/Deliveries to Residential Consumers (Thousand Gallons) | |||||
| Decade | Year-0 | Year-1 | Year-2 | Year-3 | Year-4 | Year-5 | Year-6 | Year-7 | Year-8 | Year-9 |
|---|---|---|---|---|---|---|---|---|---|---|
| 1980's | 266,368 | 255,178 | 262,853 | 236,656 | 255,530 | 241,391 | ||||
| 1990's | 209,824 | 192,877 | 182,056 | 181,463 | 161,172 | 168,476 | 167,724 | 159,320 | 116,529 | 132,807 |
| 2000's | 127,632 | 113,065 | 95,570 | 98,834 | 85,472 | 81,639 | 61,309 | 56,569 | 51,832 | 37,025 |
| 2010's | 27,236 | 26,857 | 19,090 | 23,289 | 28,869 | 21,335 | 19,703 | 18,830 | 20,167 | 22,415 |
| 2020's | 21,095 |
| - = No Data Reported; -- = Not Applicable; NA = Not Available; W = Withheld to avoid disclosure of individual company data. |
| Release Date: 2/9/2022 |
| Next Release Date: Suspended |