|
Download Data (XLS File) |
|
|||||
|
|||||
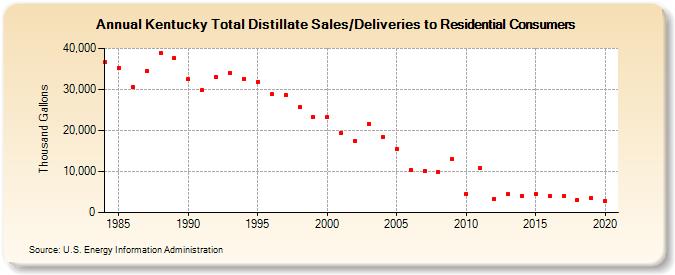
| Kentucky Total Distillate Sales/Deliveries to Residential Consumers (Thousand Gallons) | |||||
| Decade | Year-0 | Year-1 | Year-2 | Year-3 | Year-4 | Year-5 | Year-6 | Year-7 | Year-8 | Year-9 |
|---|---|---|---|---|---|---|---|---|---|---|
| 1980's | 36,601 | 35,270 | 30,492 | 34,514 | 38,958 | 37,696 | ||||
| 1990's | 32,435 | 29,758 | 33,067 | 34,069 | 32,634 | 31,914 | 28,792 | 28,616 | 25,688 | 23,206 |
| 2000's | 23,188 | 19,441 | 17,506 | 21,648 | 18,434 | 15,521 | 10,387 | 10,121 | 9,911 | 13,076 |
| 2010's | 4,553 | 10,833 | 3,334 | 4,403 | 4,149 | 4,624 | 3,987 | 3,965 | 3,082 | 3,654 |
| 2020's | 2,842 |
| - = No Data Reported; -- = Not Applicable; NA = Not Available; W = Withheld to avoid disclosure of individual company data. |
| Release Date: 2/9/2022 |
| Next Release Date: Suspended |