|
Download Data (XLS File) |
|
|||||
|
|||||
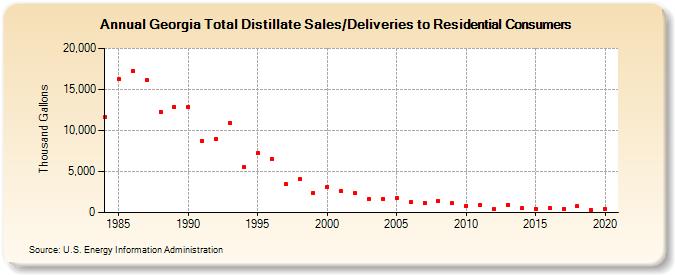
| Georgia Total Distillate Sales/Deliveries to Residential Consumers (Thousand Gallons) | |||||
| Decade | Year-0 | Year-1 | Year-2 | Year-3 | Year-4 | Year-5 | Year-6 | Year-7 | Year-8 | Year-9 |
|---|---|---|---|---|---|---|---|---|---|---|
| 1980's | 11,603 | 16,267 | 17,230 | 16,137 | 12,302 | 12,884 | ||||
| 1990's | 12,862 | 8,764 | 8,950 | 10,949 | 5,503 | 7,244 | 6,557 | 3,437 | 4,106 | 2,426 |
| 2000's | 3,148 | 2,590 | 2,376 | 1,673 | 1,687 | 1,743 | 1,252 | 1,167 | 1,391 | 1,125 |
| 2010's | 858 | 980 | 409 | 960 | 524 | 494 | 585 | 464 | 765 | 311 |
| 2020's | 418 |
| - = No Data Reported; -- = Not Applicable; NA = Not Available; W = Withheld to avoid disclosure of individual company data. |
| Release Date: 2/9/2022 |
| Next Release Date: Suspended |