|
Download Data (XLS File) |
|
|||||
|
|||||
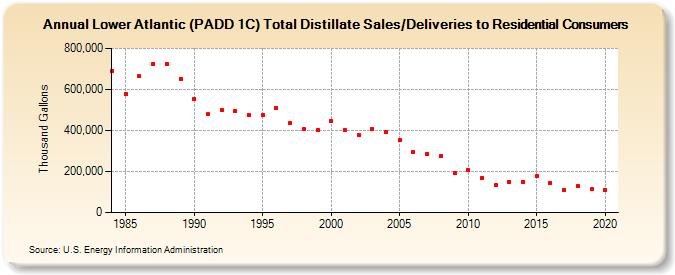
| Lower Atlantic (PADD 1C) Total Distillate Sales/Deliveries to Residential Consumers (Thousand Gallons) | |||||
| Decade | Year-0 | Year-1 | Year-2 | Year-3 | Year-4 | Year-5 | Year-6 | Year-7 | Year-8 | Year-9 |
|---|---|---|---|---|---|---|---|---|---|---|
| 1980's | 689,727 | 577,715 | 664,074 | 726,125 | 724,651 | 652,549 | ||||
| 1990's | 552,535 | 478,553 | 500,122 | 493,488 | 477,812 | 475,390 | 508,669 | 435,203 | 405,737 | 401,751 |
| 2000's | 444,774 | 401,591 | 377,126 | 408,785 | 391,949 | 351,699 | 296,066 | 285,053 | 273,407 | 193,873 |
| 2010's | 207,472 | 170,501 | 133,576 | 148,946 | 147,961 | 176,218 | 145,213 | 110,741 | 129,744 | 113,950 |
| 2020's | 108,992 |
| - = No Data Reported; -- = Not Applicable; NA = Not Available; W = Withheld to avoid disclosure of individual company data. |
| Release Date: 2/9/2022 |
| Next Release Date: Suspended |