|
Download Data (XLS File) |
|
|||||
|
|||||
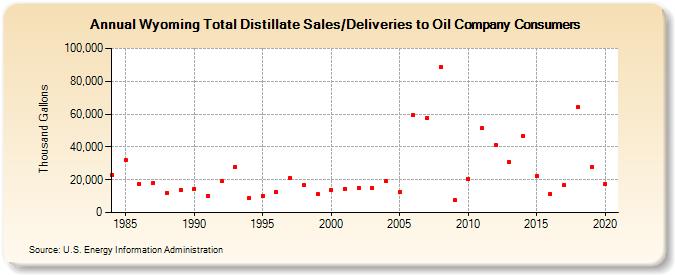
| Wyoming Total Distillate Sales/Deliveries to Oil Company Consumers (Thousand Gallons) | |||||
| Decade | Year-0 | Year-1 | Year-2 | Year-3 | Year-4 | Year-5 | Year-6 | Year-7 | Year-8 | Year-9 |
|---|---|---|---|---|---|---|---|---|---|---|
| 1980's | 22,996 | 31,986 | 17,255 | 17,885 | 12,132 | 13,686 | ||||
| 1990's | 14,589 | 10,190 | 19,200 | 28,030 | 8,766 | 10,373 | 12,557 | 21,304 | 16,646 | 11,147 |
| 2000's | 13,992 | 14,541 | 15,169 | 15,179 | 19,207 | 12,483 | 59,273 | 57,803 | 88,559 | 7,458 |
| 2010's | 20,496 | 51,502 | 40,977 | 30,654 | 46,930 | 22,471 | 11,414 | 16,770 | 64,246 | 27,590 |
| 2020's | 17,447 |
| - = No Data Reported; -- = Not Applicable; NA = Not Available; W = Withheld to avoid disclosure of individual company data. |
| Release Date: 2/9/2022 |
| Next Release Date: Suspended |