|
Download Data (XLS File) |
|
|||||
|
|||||
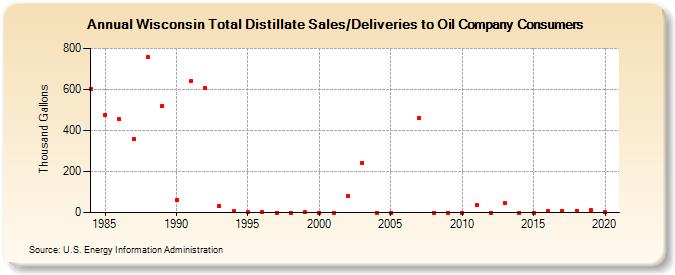
| Wisconsin Total Distillate Sales/Deliveries to Oil Company Consumers (Thousand Gallons) | |||||
| Decade | Year-0 | Year-1 | Year-2 | Year-3 | Year-4 | Year-5 | Year-6 | Year-7 | Year-8 | Year-9 |
|---|---|---|---|---|---|---|---|---|---|---|
| 1980's | 604 | 477 | 454 | 359 | 757 | 518 | ||||
| 1990's | 61 | 641 | 608 | 31 | 7 | 2 | 2 | 0 | 0 | 2 |
| 2000's | 0 | 0 | 80 | 243 | 0 | 0 | -- | 462 | 0 | 0 |
| 2010's | 0 | 37 | 0 | 47 | 0 | 0 | 7 | 9 | 8 | 11 |
| 2020's | 5 |
| - = No Data Reported; -- = Not Applicable; NA = Not Available; W = Withheld to avoid disclosure of individual company data. |
| Release Date: 2/9/2022 |
| Next Release Date: Suspended |