|
Download Data (XLS File) |
|
|||||
|
|||||
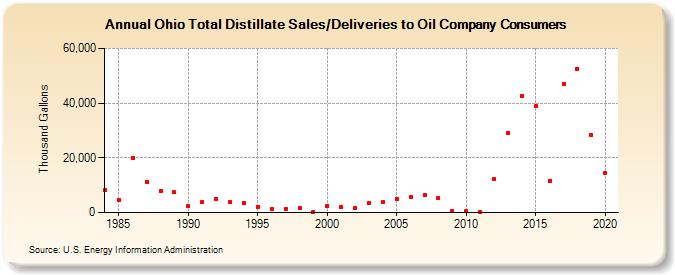
| Ohio Total Distillate Sales/Deliveries to Oil Company Consumers (Thousand Gallons) | |||||
| Decade | Year-0 | Year-1 | Year-2 | Year-3 | Year-4 | Year-5 | Year-6 | Year-7 | Year-8 | Year-9 |
|---|---|---|---|---|---|---|---|---|---|---|
| 1980's | 8,142 | 4,707 | 20,059 | 11,174 | 7,892 | 7,414 | ||||
| 1990's | 2,448 | 3,727 | 5,027 | 3,876 | 3,638 | 2,172 | 1,159 | 1,454 | 1,584 | 309 |
| 2000's | 2,383 | 1,924 | 1,734 | 3,561 | 3,732 | 5,119 | 5,698 | 6,312 | 5,271 | 459 |
| 2010's | 493 | 205 | 12,335 | 29,057 | 42,721 | 39,019 | 11,629 | 46,932 | 52,585 | 28,454 |
| 2020's | 14,601 |
| - = No Data Reported; -- = Not Applicable; NA = Not Available; W = Withheld to avoid disclosure of individual company data. |
| Release Date: 2/9/2022 |
| Next Release Date: Suspended |