|
Download Data (XLS File) |
|
|||||
|
|||||
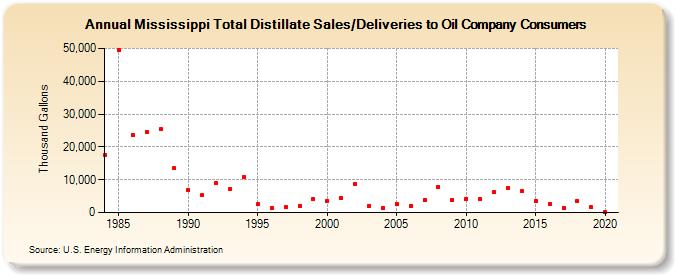
| Mississippi Total Distillate Sales/Deliveries to Oil Company Consumers (Thousand Gallons) | |||||
| Decade | Year-0 | Year-1 | Year-2 | Year-3 | Year-4 | Year-5 | Year-6 | Year-7 | Year-8 | Year-9 |
|---|---|---|---|---|---|---|---|---|---|---|
| 1980's | 17,602 | 49,556 | 23,671 | 24,679 | 25,378 | 13,504 | ||||
| 1990's | 6,948 | 5,219 | 8,948 | 7,170 | 10,905 | 2,458 | 1,329 | 1,557 | 2,084 | 4,065 |
| 2000's | 3,567 | 4,468 | 8,830 | 2,059 | 1,401 | 2,656 | 2,148 | 3,823 | 7,881 | 3,955 |
| 2010's | 4,262 | 4,058 | 6,226 | 7,450 | 6,419 | 3,506 | 2,628 | 1,522 | 3,555 | 1,615 |
| 2020's | 122 |
| - = No Data Reported; -- = Not Applicable; NA = Not Available; W = Withheld to avoid disclosure of individual company data. |
| Release Date: 2/9/2022 |
| Next Release Date: Suspended |