|
Download Data (XLS File) |
|
|||||
|
|||||
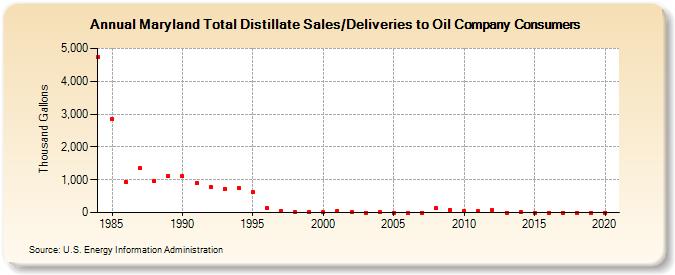
| Maryland Total Distillate Sales/Deliveries to Oil Company Consumers (Thousand Gallons) | |||||
| Decade | Year-0 | Year-1 | Year-2 | Year-3 | Year-4 | Year-5 | Year-6 | Year-7 | Year-8 | Year-9 |
|---|---|---|---|---|---|---|---|---|---|---|
| 1980's | 4,725 | 2,852 | 925 | 1,343 | 958 | 1,113 | ||||
| 1990's | 1,101 | 893 | 781 | 724 | 738 | 616 | 134 | 45 | 31 | 16 |
| 2000's | 4 | 61 | 8 | 0 | 2 | 0 | 0 | 0 | 129 | 87 |
| 2010's | 48 | 36 | 70 | 0 | 24 | 0 | 0 | 0 | 0 | 0 |
| 2020's | 0 |
| - = No Data Reported; -- = Not Applicable; NA = Not Available; W = Withheld to avoid disclosure of individual company data. |
| Release Date: 2/9/2022 |
| Next Release Date: Suspended |