|
Download Data (XLS File) |
|
|||||
|
|||||
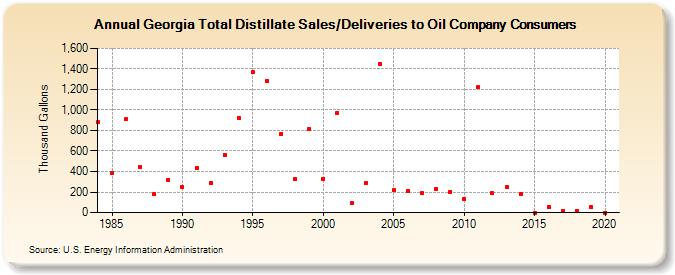
| Georgia Total Distillate Sales/Deliveries to Oil Company Consumers (Thousand Gallons) | |||||
| Decade | Year-0 | Year-1 | Year-2 | Year-3 | Year-4 | Year-5 | Year-6 | Year-7 | Year-8 | Year-9 |
|---|---|---|---|---|---|---|---|---|---|---|
| 1980's | 881 | 387 | 909 | 447 | 178 | 321 | ||||
| 1990's | 249 | 437 | 291 | 565 | 921 | 1,366 | 1,280 | 766 | 324 | 810 |
| 2000's | 331 | 969 | 90 | 287 | 1,451 | 219 | 206 | 188 | 231 | 203 |
| 2010's | 129 | 1,221 | 188 | 250 | 179 | 0 | 53 | 17 | 18 | 52 |
| 2020's | 0 |
| - = No Data Reported; -- = Not Applicable; NA = Not Available; W = Withheld to avoid disclosure of individual company data. |
| Release Date: 2/9/2022 |
| Next Release Date: Suspended |