|
Download Data (XLS File) |
|
|||||
|
|||||
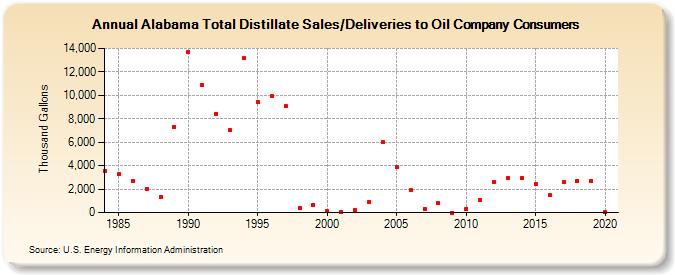
| Alabama Total Distillate Sales/Deliveries to Oil Company Consumers (Thousand Gallons) | |||||
| Decade | Year-0 | Year-1 | Year-2 | Year-3 | Year-4 | Year-5 | Year-6 | Year-7 | Year-8 | Year-9 |
|---|---|---|---|---|---|---|---|---|---|---|
| 1980's | 3,541 | 3,249 | 2,723 | 2,030 | 1,361 | 7,313 | ||||
| 1990's | 13,692 | 10,859 | 8,439 | 7,067 | 13,155 | 9,429 | 9,902 | 9,057 | 371 | 665 |
| 2000's | 131 | 67 | 245 | 903 | 6,030 | 3,893 | 1,939 | 320 | 815 | 0 |
| 2010's | 328 | 1,035 | 2,640 | 2,929 | 2,985 | 2,412 | 1,472 | 2,624 | 2,722 | 2,703 |
| 2020's | 22 |
| - = No Data Reported; -- = Not Applicable; NA = Not Available; W = Withheld to avoid disclosure of individual company data. |
| Release Date: 2/9/2022 |
| Next Release Date: Suspended |