|
Download Data (XLS File) |
|
|||||
|
|||||
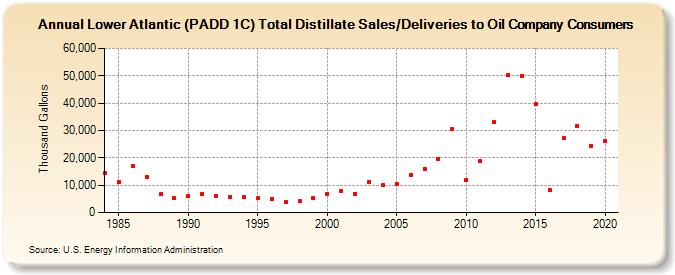
| Lower Atlantic (PADD 1C) Total Distillate Sales/Deliveries to Oil Company Consumers (Thousand Gallons) | |||||
| Decade | Year-0 | Year-1 | Year-2 | Year-3 | Year-4 | Year-5 | Year-6 | Year-7 | Year-8 | Year-9 |
|---|---|---|---|---|---|---|---|---|---|---|
| 1980's | 14,577 | 11,212 | 17,028 | 13,111 | 6,677 | 5,355 | ||||
| 1990's | 6,102 | 6,726 | 5,873 | 5,658 | 5,588 | 5,317 | 4,930 | 3,978 | 4,072 | 5,269 |
| 2000's | 6,803 | 7,702 | 6,716 | 11,194 | 9,892 | 10,441 | 13,758 | 15,972 | 19,739 | 30,448 |
| 2010's | 11,881 | 18,782 | 33,156 | 50,313 | 49,855 | 39,630 | 8,291 | 27,370 | 31,546 | 24,483 |
| 2020's | 26,040 |
| - = No Data Reported; -- = Not Applicable; NA = Not Available; W = Withheld to avoid disclosure of individual company data. |
| Release Date: 2/9/2022 |
| Next Release Date: Suspended |