|
Download Data (XLS File) |
|
|||||
|
|||||
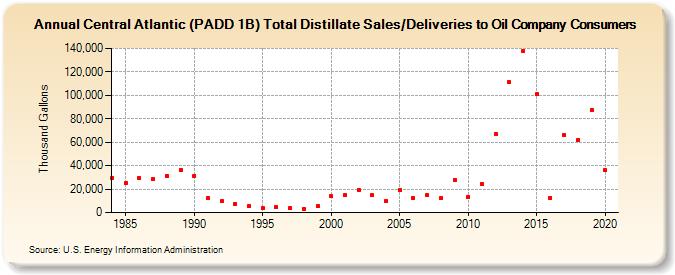
| Central Atlantic (PADD 1B) Total Distillate Sales/Deliveries to Oil Company Consumers (Thousand Gallons) | |||||
| Decade | Year-0 | Year-1 | Year-2 | Year-3 | Year-4 | Year-5 | Year-6 | Year-7 | Year-8 | Year-9 |
|---|---|---|---|---|---|---|---|---|---|---|
| 1980's | 29,622 | 24,969 | 29,283 | 28,777 | 31,600 | 36,606 | ||||
| 1990's | 31,603 | 12,295 | 9,579 | 7,348 | 5,403 | 3,623 | 4,445 | 3,699 | 3,079 | 5,383 |
| 2000's | 13,830 | 14,713 | 19,255 | 14,667 | 9,664 | 19,567 | 12,051 | 14,850 | 12,350 | 27,638 |
| 2010's | 13,528 | 24,570 | 67,199 | 111,110 | 138,128 | 100,692 | 12,841 | 65,765 | 61,666 | 87,488 |
| 2020's | 35,990 |
| - = No Data Reported; -- = Not Applicable; NA = Not Available; W = Withheld to avoid disclosure of individual company data. |
| Release Date: 2/9/2022 |
| Next Release Date: Suspended |