|
Download Data (XLS File) |
|
|||||
|
|||||
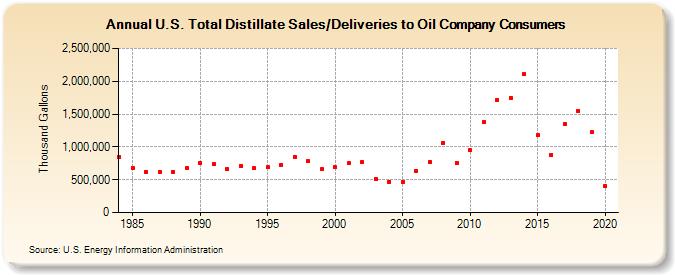
| U.S. Total Distillate Sales/Deliveries to Oil Company Consumers (Thousand Gallons) | |||||
| Decade | Year-0 | Year-1 | Year-2 | Year-3 | Year-4 | Year-5 | Year-6 | Year-7 | Year-8 | Year-9 |
|---|---|---|---|---|---|---|---|---|---|---|
| 1980's | 848,083 | 684,227 | 623,004 | 618,193 | 622,736 | 683,683 | ||||
| 1990's | 751,450 | 738,618 | 664,408 | 709,404 | 675,228 | 686,750 | 730,676 | 852,015 | 783,719 | 659,039 |
| 2000's | 686,454 | 747,627 | 770,682 | 513,511 | 472,920 | 472,922 | 636,788 | 774,984 | 1,066,688 | 760,877 |
| 2010's | 951,322 | 1,381,127 | 1,710,513 | 1,751,162 | 2,105,058 | 1,177,711 | 882,682 | 1,348,268 | 1,552,690 | 1,220,874 |
| 2020's | 405,313 |
| - = No Data Reported; -- = Not Applicable; NA = Not Available; W = Withheld to avoid disclosure of individual company data. |
| Release Date: 2/9/2022 |
| Next Release Date: Suspended |