|
Download Data (XLS File) |
|
|||||
|
|||||
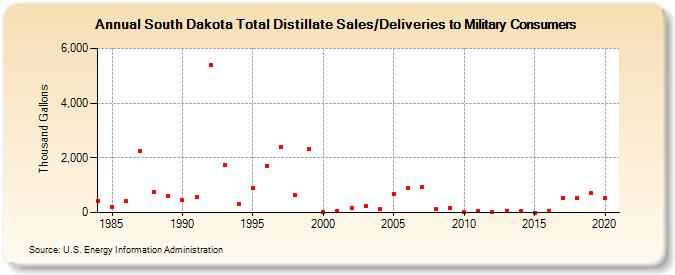
| South Dakota Total Distillate Sales/Deliveries to Military Consumers (Thousand Gallons) | |||||
| Decade | Year-0 | Year-1 | Year-2 | Year-3 | Year-4 | Year-5 | Year-6 | Year-7 | Year-8 | Year-9 |
|---|---|---|---|---|---|---|---|---|---|---|
| 1980's | 430 | 221 | 421 | 2,267 | 763 | 616 | ||||
| 1990's | 458 | 564 | 5,401 | 1,752 | 297 | 888 | 1,711 | 2,413 | 632 | 2,315 |
| 2000's | 29 | 53 | 156 | 224 | 114 | 696 | 915 | 929 | 137 | 171 |
| 2010's | 20 | 53 | 24 | 71 | 41 | 1 | 56 | 537 | 536 | 709 |
| 2020's | 520 |
| - = No Data Reported; -- = Not Applicable; NA = Not Available; W = Withheld to avoid disclosure of individual company data. |
| Release Date: 2/9/2022 |
| Next Release Date: Suspended |