|
Download Data (XLS File) |
|
|||||
|
|||||
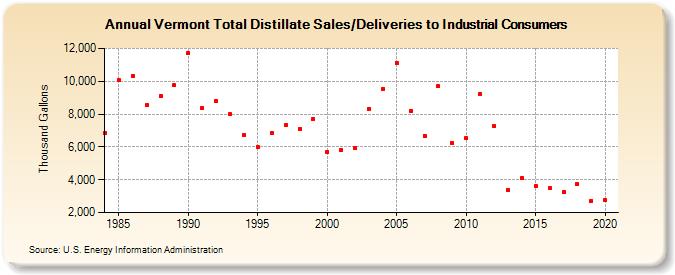
| Vermont Total Distillate Sales/Deliveries to Industrial Consumers (Thousand Gallons) | |||||
| Decade | Year-0 | Year-1 | Year-2 | Year-3 | Year-4 | Year-5 | Year-6 | Year-7 | Year-8 | Year-9 |
|---|---|---|---|---|---|---|---|---|---|---|
| 1980's | 6,845 | 10,047 | 10,344 | 8,538 | 9,106 | 9,742 | ||||
| 1990's | 11,735 | 8,382 | 8,795 | 7,987 | 6,719 | 5,994 | 6,820 | 7,325 | 7,119 | 7,686 |
| 2000's | 5,701 | 5,783 | 5,956 | 8,334 | 9,556 | 11,139 | 8,201 | 6,683 | 9,687 | 6,225 |
| 2010's | 6,512 | 9,234 | 7,280 | 3,373 | 4,100 | 3,628 | 3,470 | 3,254 | 3,726 | 2,711 |
| 2020's | 2,747 |
| - = No Data Reported; -- = Not Applicable; NA = Not Available; W = Withheld to avoid disclosure of individual company data. |
| Release Date: 2/9/2022 |
| Next Release Date: Suspended |