|
Download Data (XLS File) |
|
|||||
|
|||||
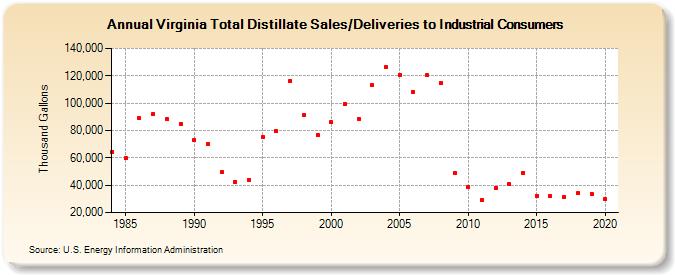
| Virginia Total Distillate Sales/Deliveries to Industrial Consumers (Thousand Gallons) | |||||
| Decade | Year-0 | Year-1 | Year-2 | Year-3 | Year-4 | Year-5 | Year-6 | Year-7 | Year-8 | Year-9 |
|---|---|---|---|---|---|---|---|---|---|---|
| 1980's | 64,472 | 59,587 | 88,924 | 91,994 | 88,088 | 85,089 | ||||
| 1990's | 73,040 | 69,965 | 49,562 | 42,270 | 44,072 | 74,907 | 79,727 | 116,363 | 91,020 | 76,944 |
| 2000's | 85,885 | 99,407 | 88,602 | 113,000 | 126,503 | 120,654 | 108,411 | 120,505 | 114,834 | 48,664 |
| 2010's | 38,748 | 29,518 | 38,307 | 40,584 | 49,233 | 32,114 | 31,801 | 31,377 | 34,018 | 33,778 |
| 2020's | 29,560 |
| - = No Data Reported; -- = Not Applicable; NA = Not Available; W = Withheld to avoid disclosure of individual company data. |
| Release Date: 2/9/2022 |
| Next Release Date: Suspended |