|
Download Data (XLS File) |
|
|||||
|
|||||
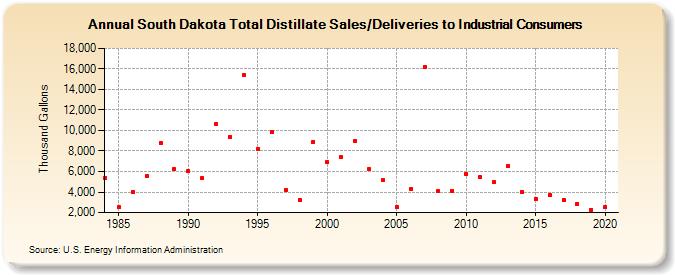
| South Dakota Total Distillate Sales/Deliveries to Industrial Consumers (Thousand Gallons) | |||||
| Decade | Year-0 | Year-1 | Year-2 | Year-3 | Year-4 | Year-5 | Year-6 | Year-7 | Year-8 | Year-9 |
|---|---|---|---|---|---|---|---|---|---|---|
| 1980's | 5,408 | 2,515 | 4,037 | 5,532 | 8,794 | 6,198 | ||||
| 1990's | 6,062 | 5,390 | 10,653 | 9,401 | 15,430 | 8,224 | 9,850 | 4,221 | 3,226 | 8,905 |
| 2000's | 6,924 | 7,375 | 9,003 | 6,225 | 5,172 | 2,524 | 4,299 | 16,183 | 4,065 | 4,126 |
| 2010's | 5,778 | 5,459 | 4,977 | 6,551 | 4,051 | 3,353 | 3,696 | 3,241 | 2,859 | 2,281 |
| 2020's | 2,566 |
| - = No Data Reported; -- = Not Applicable; NA = Not Available; W = Withheld to avoid disclosure of individual company data. |
| Release Date: 2/9/2022 |
| Next Release Date: Suspended |