|
Download Data (XLS File) |
|
|||||
|
|||||
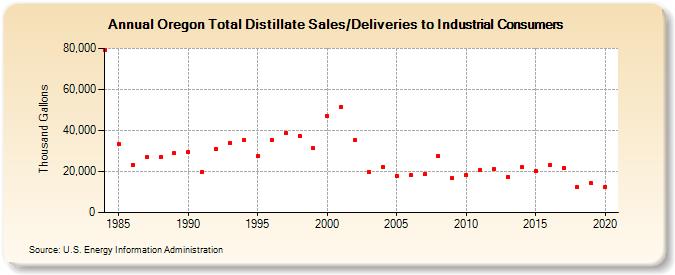
| Oregon Total Distillate Sales/Deliveries to Industrial Consumers (Thousand Gallons) | |||||
| Decade | Year-0 | Year-1 | Year-2 | Year-3 | Year-4 | Year-5 | Year-6 | Year-7 | Year-8 | Year-9 |
|---|---|---|---|---|---|---|---|---|---|---|
| 1980's | 79,032 | 33,297 | 23,316 | 26,860 | 26,879 | 28,868 | ||||
| 1990's | 29,587 | 19,648 | 31,067 | 34,088 | 35,129 | 27,564 | 35,516 | 38,751 | 37,392 | 31,269 |
| 2000's | 46,901 | 51,650 | 35,596 | 19,958 | 22,218 | 17,961 | 18,130 | 18,645 | 27,537 | 16,709 |
| 2010's | 18,349 | 20,837 | 21,115 | 17,471 | 21,966 | 20,096 | 23,149 | 21,774 | 12,254 | 14,166 |
| 2020's | 12,362 |
| - = No Data Reported; -- = Not Applicable; NA = Not Available; W = Withheld to avoid disclosure of individual company data. |
| Release Date: 2/9/2022 |
| Next Release Date: Suspended |