|
Download Data (XLS File) |
|
|||||
|
|||||
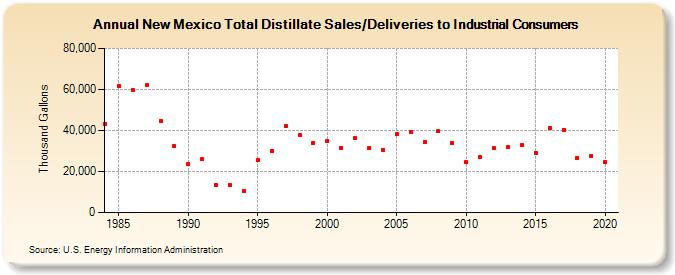
| New Mexico Total Distillate Sales/Deliveries to Industrial Consumers (Thousand Gallons) | |||||
| Decade | Year-0 | Year-1 | Year-2 | Year-3 | Year-4 | Year-5 | Year-6 | Year-7 | Year-8 | Year-9 |
|---|---|---|---|---|---|---|---|---|---|---|
| 1980's | 43,374 | 61,747 | 59,536 | 62,010 | 44,856 | 32,365 | ||||
| 1990's | 23,602 | 25,962 | 13,199 | 13,317 | 10,391 | 25,375 | 30,167 | 42,251 | 37,602 | 33,910 |
| 2000's | 34,914 | 31,688 | 36,161 | 31,282 | 30,631 | 38,076 | 39,471 | 34,612 | 39,583 | 33,804 |
| 2010's | 24,429 | 27,110 | 31,316 | 32,029 | 32,917 | 29,151 | 41,270 | 40,394 | 26,521 | 27,447 |
| 2020's | 24,828 |
| - = No Data Reported; -- = Not Applicable; NA = Not Available; W = Withheld to avoid disclosure of individual company data. |
| Release Date: 2/9/2022 |
| Next Release Date: Suspended |