|
Download Data (XLS File) |
|
|||||
|
|||||
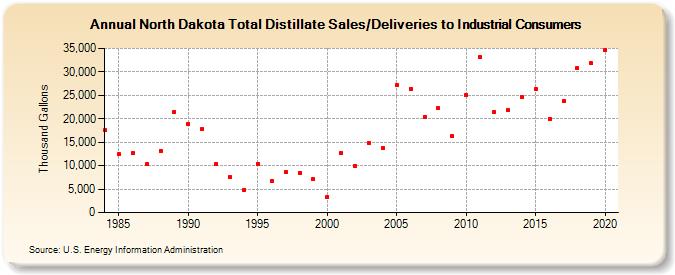
| North Dakota Total Distillate Sales/Deliveries to Industrial Consumers (Thousand Gallons) | |||||
| Decade | Year-0 | Year-1 | Year-2 | Year-3 | Year-4 | Year-5 | Year-6 | Year-7 | Year-8 | Year-9 |
|---|---|---|---|---|---|---|---|---|---|---|
| 1980's | 17,511 | 12,397 | 12,610 | 10,285 | 13,217 | 21,476 | ||||
| 1990's | 18,829 | 17,819 | 10,357 | 7,606 | 4,878 | 10,442 | 6,819 | 8,642 | 8,502 | 7,072 |
| 2000's | 3,303 | 12,656 | 10,000 | 14,924 | 13,716 | 27,208 | 26,438 | 20,462 | 22,211 | 16,319 |
| 2010's | 25,117 | 33,121 | 21,456 | 21,803 | 24,533 | 26,292 | 20,023 | 23,739 | 30,753 | 31,808 |
| 2020's | 34,653 |
| - = No Data Reported; -- = Not Applicable; NA = Not Available; W = Withheld to avoid disclosure of individual company data. |
| Release Date: 2/9/2022 |
| Next Release Date: Suspended |