|
Download Data (XLS File) |
|
|||||
|
|||||
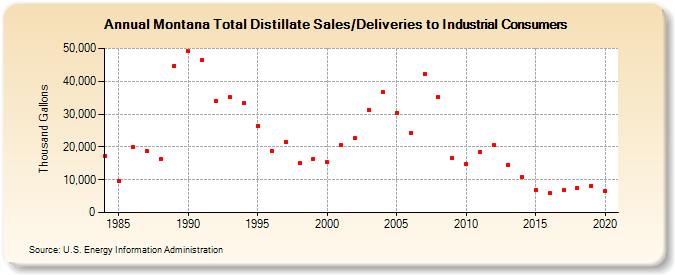
| Montana Total Distillate Sales/Deliveries to Industrial Consumers (Thousand Gallons) | |||||
| Decade | Year-0 | Year-1 | Year-2 | Year-3 | Year-4 | Year-5 | Year-6 | Year-7 | Year-8 | Year-9 |
|---|---|---|---|---|---|---|---|---|---|---|
| 1980's | 17,157 | 9,568 | 19,993 | 18,623 | 16,368 | 44,728 | ||||
| 1990's | 49,200 | 46,479 | 34,000 | 35,087 | 33,382 | 26,415 | 18,679 | 21,552 | 15,079 | 16,339 |
| 2000's | 15,299 | 20,473 | 22,592 | 31,346 | 36,627 | 30,403 | 24,365 | 42,205 | 35,204 | 16,622 |
| 2010's | 14,929 | 18,586 | 20,507 | 14,541 | 10,944 | 6,910 | 5,864 | 6,735 | 7,546 | 8,190 |
| 2020's | 6,452 |
| - = No Data Reported; -- = Not Applicable; NA = Not Available; W = Withheld to avoid disclosure of individual company data. |
| Release Date: 2/9/2022 |
| Next Release Date: Suspended |