|
Download Data (XLS File) |
|
|||||
|
|||||
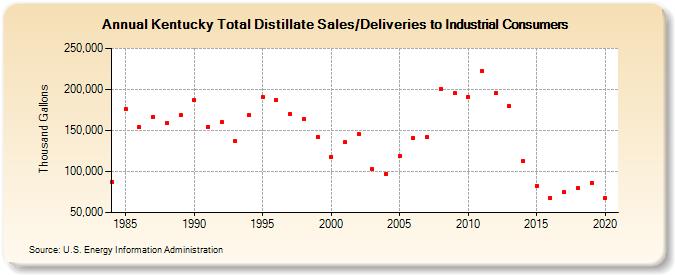
| Kentucky Total Distillate Sales/Deliveries to Industrial Consumers (Thousand Gallons) | |||||
| Decade | Year-0 | Year-1 | Year-2 | Year-3 | Year-4 | Year-5 | Year-6 | Year-7 | Year-8 | Year-9 |
|---|---|---|---|---|---|---|---|---|---|---|
| 1980's | 87,381 | 176,316 | 154,139 | 166,979 | 159,574 | 168,586 | ||||
| 1990's | 187,132 | 154,816 | 160,579 | 136,666 | 168,375 | 190,269 | 187,129 | 170,041 | 163,665 | 142,200 |
| 2000's | 118,066 | 135,362 | 146,214 | 103,009 | 96,827 | 118,799 | 141,102 | 141,726 | 201,020 | 195,386 |
| 2010's | 190,792 | 222,744 | 195,406 | 179,803 | 112,674 | 82,950 | 68,264 | 74,829 | 79,663 | 86,201 |
| 2020's | 67,695 |
| - = No Data Reported; -- = Not Applicable; NA = Not Available; W = Withheld to avoid disclosure of individual company data. |
| Release Date: 2/9/2022 |
| Next Release Date: Suspended |