|
Download Data (XLS File) |
|
|||||
|
|||||
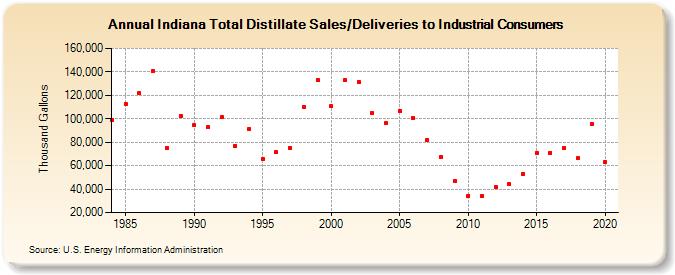
| Indiana Total Distillate Sales/Deliveries to Industrial Consumers (Thousand Gallons) | |||||
| Decade | Year-0 | Year-1 | Year-2 | Year-3 | Year-4 | Year-5 | Year-6 | Year-7 | Year-8 | Year-9 |
|---|---|---|---|---|---|---|---|---|---|---|
| 1980's | 98,957 | 112,856 | 121,725 | 140,359 | 74,847 | 102,287 | ||||
| 1990's | 94,403 | 92,580 | 101,157 | 77,003 | 91,305 | 65,886 | 71,424 | 75,290 | 110,181 | 133,449 |
| 2000's | 110,456 | 133,003 | 131,292 | 104,932 | 96,290 | 106,548 | 100,812 | 82,027 | 67,303 | 46,588 |
| 2010's | 34,450 | 34,279 | 42,118 | 44,014 | 52,747 | 71,191 | 71,198 | 75,049 | 66,248 | 95,388 |
| 2020's | 63,402 |
| - = No Data Reported; -- = Not Applicable; NA = Not Available; W = Withheld to avoid disclosure of individual company data. |
| Release Date: 2/9/2022 |
| Next Release Date: Suspended |