|
Download Data (XLS File) |
|
|||||
|
|||||
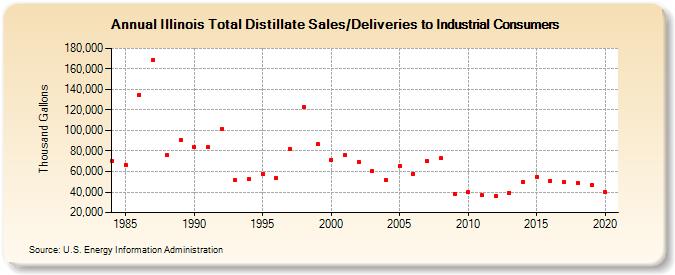
| Illinois Total Distillate Sales/Deliveries to Industrial Consumers (Thousand Gallons) | |||||
| Decade | Year-0 | Year-1 | Year-2 | Year-3 | Year-4 | Year-5 | Year-6 | Year-7 | Year-8 | Year-9 |
|---|---|---|---|---|---|---|---|---|---|---|
| 1980's | 70,379 | 66,696 | 134,781 | 168,684 | 75,758 | 91,162 | ||||
| 1990's | 83,442 | 83,494 | 101,868 | 51,343 | 52,811 | 57,909 | 53,891 | 82,293 | 123,124 | 86,346 |
| 2000's | 71,510 | 75,682 | 69,476 | 60,344 | 52,020 | 65,259 | 58,065 | 70,444 | 72,721 | 38,223 |
| 2010's | 39,583 | 37,214 | 36,050 | 39,312 | 50,165 | 54,789 | 50,832 | 50,227 | 48,846 | 46,804 |
| 2020's | 39,836 |
| - = No Data Reported; -- = Not Applicable; NA = Not Available; W = Withheld to avoid disclosure of individual company data. |
| Release Date: 2/9/2022 |
| Next Release Date: Suspended |