|
Download Data (XLS File) |
|
|||||
|
|||||
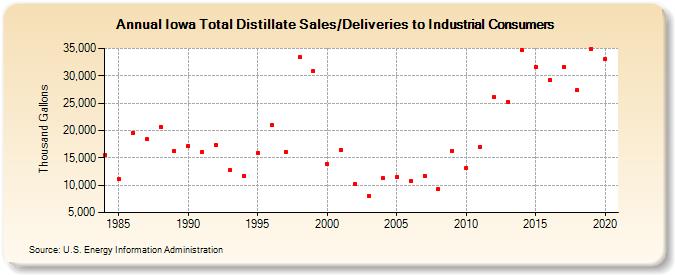
| Iowa Total Distillate Sales/Deliveries to Industrial Consumers (Thousand Gallons) | |||||
| Decade | Year-0 | Year-1 | Year-2 | Year-3 | Year-4 | Year-5 | Year-6 | Year-7 | Year-8 | Year-9 |
|---|---|---|---|---|---|---|---|---|---|---|
| 1980's | 15,574 | 11,068 | 19,613 | 18,357 | 20,685 | 16,214 | ||||
| 1990's | 17,207 | 16,070 | 17,267 | 12,806 | 11,754 | 15,857 | 21,014 | 16,142 | 33,351 | 30,841 |
| 2000's | 13,796 | 16,503 | 10,243 | 8,063 | 11,240 | 11,450 | 10,678 | 11,772 | 9,281 | 16,326 |
| 2010's | 13,189 | 17,006 | 26,122 | 25,281 | 34,726 | 31,569 | 29,239 | 31,662 | 27,347 | 34,950 |
| 2020's | 33,010 |
| - = No Data Reported; -- = Not Applicable; NA = Not Available; W = Withheld to avoid disclosure of individual company data. |
| Release Date: 2/9/2022 |
| Next Release Date: Suspended |