|
Download Data (XLS File) |
|
|||||
|
|||||
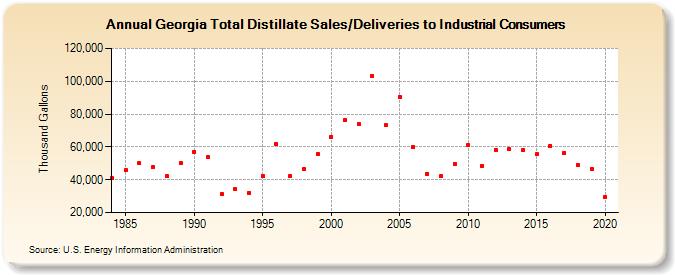
| Georgia Total Distillate Sales/Deliveries to Industrial Consumers (Thousand Gallons) | |||||
| Decade | Year-0 | Year-1 | Year-2 | Year-3 | Year-4 | Year-5 | Year-6 | Year-7 | Year-8 | Year-9 |
|---|---|---|---|---|---|---|---|---|---|---|
| 1980's | 40,858 | 45,713 | 49,890 | 47,593 | 42,006 | 50,211 | ||||
| 1990's | 57,124 | 53,631 | 31,161 | 34,149 | 32,175 | 42,539 | 61,682 | 42,144 | 46,422 | 55,537 |
| 2000's | 66,210 | 76,336 | 73,644 | 102,886 | 73,123 | 90,643 | 59,925 | 43,792 | 41,974 | 49,669 |
| 2010's | 60,982 | 48,604 | 58,341 | 58,607 | 57,831 | 55,423 | 60,577 | 56,285 | 48,958 | 46,677 |
| 2020's | 29,396 |
| - = No Data Reported; -- = Not Applicable; NA = Not Available; W = Withheld to avoid disclosure of individual company data. |
| Release Date: 2/9/2022 |
| Next Release Date: Suspended |