|
Download Data (XLS File) |
|
|||||
|
|||||
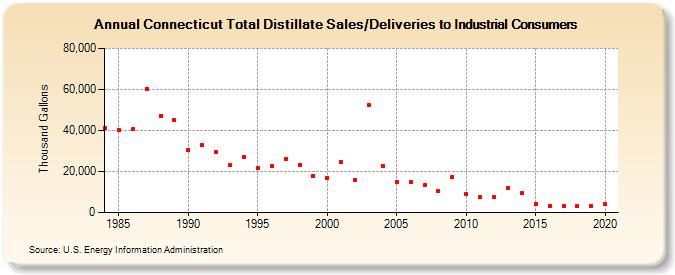
| Connecticut Total Distillate Sales/Deliveries to Industrial Consumers (Thousand Gallons) | |||||
| Decade | Year-0 | Year-1 | Year-2 | Year-3 | Year-4 | Year-5 | Year-6 | Year-7 | Year-8 | Year-9 |
|---|---|---|---|---|---|---|---|---|---|---|
| 1980's | 41,373 | 40,134 | 40,762 | 60,362 | 47,225 | 44,923 | ||||
| 1990's | 30,273 | 32,901 | 29,431 | 23,011 | 27,109 | 21,671 | 22,685 | 25,878 | 22,994 | 18,006 |
| 2000's | 17,008 | 24,716 | 16,094 | 52,299 | 22,895 | 14,693 | 14,669 | 13,312 | 10,362 | 17,414 |
| 2010's | 8,976 | 7,576 | 7,427 | 11,850 | 9,395 | 4,405 | 3,174 | 3,058 | 2,997 | 3,257 |
| 2020's | 4,016 |
| - = No Data Reported; -- = Not Applicable; NA = Not Available; W = Withheld to avoid disclosure of individual company data. |
| Release Date: 2/9/2022 |
| Next Release Date: Suspended |