|
Download Data (XLS File) |
|
|||||
|
|||||
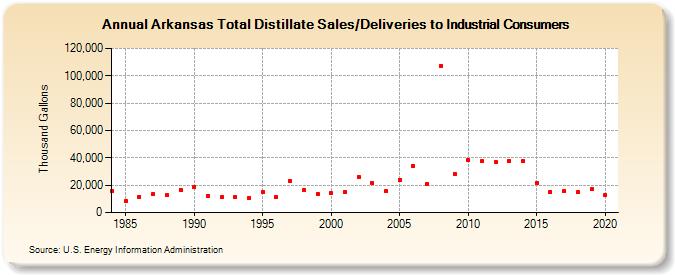
| Arkansas Total Distillate Sales/Deliveries to Industrial Consumers (Thousand Gallons) | |||||
| Decade | Year-0 | Year-1 | Year-2 | Year-3 | Year-4 | Year-5 | Year-6 | Year-7 | Year-8 | Year-9 |
|---|---|---|---|---|---|---|---|---|---|---|
| 1980's | 15,476 | 8,297 | 11,581 | 13,527 | 12,796 | 16,765 | ||||
| 1990's | 18,556 | 12,187 | 11,367 | 11,314 | 10,663 | 15,079 | 11,304 | 23,170 | 16,542 | 13,825 |
| 2000's | 14,447 | 15,226 | 26,100 | 21,581 | 15,724 | 24,056 | 34,072 | 20,854 | 107,268 | 28,351 |
| 2010's | 38,578 | 37,500 | 36,972 | 37,692 | 37,414 | 21,844 | 15,066 | 15,802 | 14,770 | 17,115 |
| 2020's | 12,613 |
| - = No Data Reported; -- = Not Applicable; NA = Not Available; W = Withheld to avoid disclosure of individual company data. |
| Release Date: 2/9/2022 |
| Next Release Date: Suspended |