|
Download Data (XLS File) |
|
|||||
|
|||||
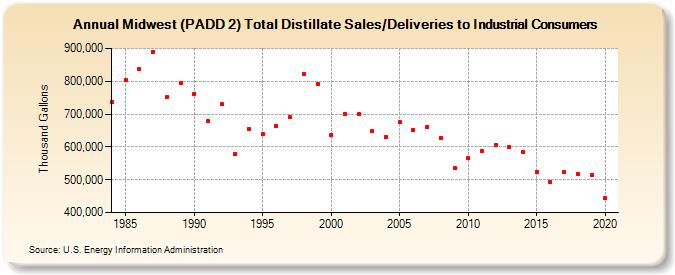
| Midwest (PADD 2) Total Distillate Sales/Deliveries to Industrial Consumers (Thousand Gallons) | |||||
| Decade | Year-0 | Year-1 | Year-2 | Year-3 | Year-4 | Year-5 | Year-6 | Year-7 | Year-8 | Year-9 |
|---|---|---|---|---|---|---|---|---|---|---|
| 1980's | 736,268 | 804,288 | 836,827 | 890,196 | 751,713 | 794,541 | ||||
| 1990's | 762,579 | 678,713 | 731,018 | 579,829 | 653,128 | 639,882 | 662,986 | 691,230 | 823,485 | 792,158 |
| 2000's | 636,772 | 700,432 | 699,833 | 649,349 | 630,589 | 675,500 | 651,699 | 659,540 | 628,543 | 534,346 |
| 2010's | 565,555 | 586,792 | 606,246 | 601,024 | 584,207 | 523,987 | 492,816 | 524,978 | 516,820 | 514,114 |
| 2020's | 445,247 |
| - = No Data Reported; -- = Not Applicable; NA = Not Available; W = Withheld to avoid disclosure of individual company data. |
| Release Date: 2/9/2022 |
| Next Release Date: Suspended |