|
Download Data (XLS File) |
|
|||||
|
|||||
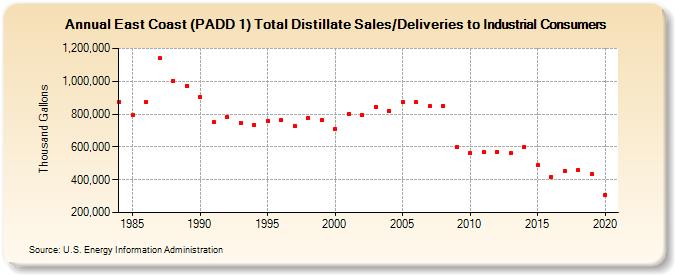
| East Coast (PADD 1) Total Distillate Sales/Deliveries to Industrial Consumers (Thousand Gallons) | |||||
| Decade | Year-0 | Year-1 | Year-2 | Year-3 | Year-4 | Year-5 | Year-6 | Year-7 | Year-8 | Year-9 |
|---|---|---|---|---|---|---|---|---|---|---|
| 1980's | 875,249 | 792,619 | 874,729 | 1,138,883 | 1,003,201 | 973,890 | ||||
| 1990's | 903,065 | 750,243 | 781,208 | 748,208 | 733,386 | 759,001 | 760,880 | 728,262 | 778,225 | 766,697 |
| 2000's | 711,827 | 801,129 | 795,157 | 841,484 | 819,670 | 875,054 | 870,431 | 846,364 | 851,906 | 597,048 |
| 2010's | 560,403 | 568,024 | 568,997 | 559,886 | 600,949 | 487,429 | 418,565 | 455,149 | 460,589 | 433,385 |
| 2020's | 307,843 |
| - = No Data Reported; -- = Not Applicable; NA = Not Available; W = Withheld to avoid disclosure of individual company data. |
| Release Date: 2/9/2022 |
| Next Release Date: Suspended |