|
Download Data (XLS File) |
|
|||||
|
|||||
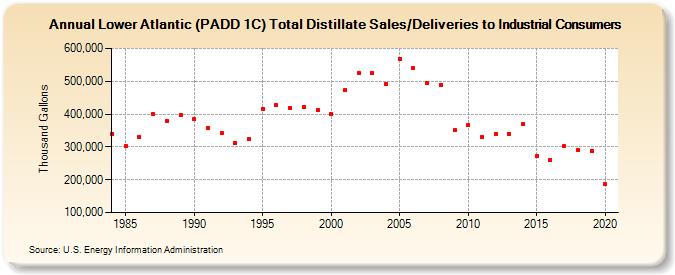
| Lower Atlantic (PADD 1C) Total Distillate Sales/Deliveries to Industrial Consumers (Thousand Gallons) | |||||
| Decade | Year-0 | Year-1 | Year-2 | Year-3 | Year-4 | Year-5 | Year-6 | Year-7 | Year-8 | Year-9 |
|---|---|---|---|---|---|---|---|---|---|---|
| 1980's | 339,808 | 301,702 | 331,511 | 399,811 | 379,229 | 396,754 | ||||
| 1990's | 384,049 | 358,093 | 341,853 | 311,383 | 323,298 | 416,838 | 426,322 | 419,536 | 421,269 | 411,765 |
| 2000's | 401,537 | 472,989 | 526,329 | 524,620 | 491,881 | 567,567 | 539,386 | 493,893 | 488,796 | 350,485 |
| 2010's | 366,317 | 329,693 | 338,772 | 340,663 | 370,801 | 271,030 | 261,254 | 301,489 | 290,959 | 288,983 |
| 2020's | 186,184 |
| - = No Data Reported; -- = Not Applicable; NA = Not Available; W = Withheld to avoid disclosure of individual company data. |
| Release Date: 2/9/2022 |
| Next Release Date: Suspended |