|
Download Data (XLS File) |
|
|||||
|
|||||
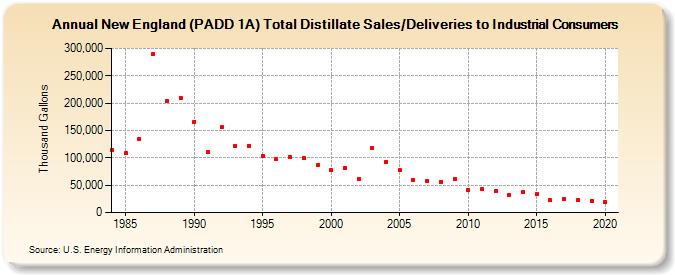
| New England (PADD 1A) Total Distillate Sales/Deliveries to Industrial Consumers (Thousand Gallons) | |||||
| Decade | Year-0 | Year-1 | Year-2 | Year-3 | Year-4 | Year-5 | Year-6 | Year-7 | Year-8 | Year-9 |
|---|---|---|---|---|---|---|---|---|---|---|
| 1980's | 113,565 | 108,226 | 135,134 | 290,296 | 203,785 | 208,952 | ||||
| 1990's | 166,165 | 111,064 | 156,405 | 121,350 | 122,129 | 103,547 | 97,688 | 101,435 | 98,815 | 86,851 |
| 2000's | 77,670 | 82,307 | 61,238 | 117,292 | 92,871 | 77,183 | 59,978 | 57,624 | 56,038 | 60,994 |
| 2010's | 41,357 | 42,972 | 39,708 | 32,967 | 37,080 | 33,353 | 22,241 | 24,465 | 23,206 | 21,427 |
| 2020's | 19,409 |
| - = No Data Reported; -- = Not Applicable; NA = Not Available; W = Withheld to avoid disclosure of individual company data. |
| Release Date: 2/9/2022 |
| Next Release Date: Suspended |