|
Download Data (XLS File) |
|
|||||
|
|||||
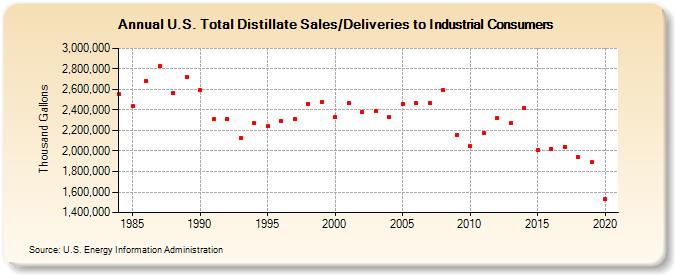
| U.S. Total Distillate Sales/Deliveries to Industrial Consumers (Thousand Gallons) | |||||
| Decade | Year-0 | Year-1 | Year-2 | Year-3 | Year-4 | Year-5 | Year-6 | Year-7 | Year-8 | Year-9 |
|---|---|---|---|---|---|---|---|---|---|---|
| 1980's | 2,555,898 | 2,440,661 | 2,681,720 | 2,823,679 | 2,562,685 | 2,725,774 | ||||
| 1990's | 2,593,312 | 2,309,184 | 2,312,146 | 2,130,358 | 2,269,007 | 2,238,873 | 2,288,689 | 2,309,615 | 2,462,355 | 2,477,719 |
| 2000's | 2,330,870 | 2,466,456 | 2,384,383 | 2,394,445 | 2,326,604 | 2,459,711 | 2,463,676 | 2,466,906 | 2,593,750 | 2,159,428 |
| 2010's | 2,045,164 | 2,179,953 | 2,325,503 | 2,271,056 | 2,417,898 | 2,009,585 | 2,018,488 | 2,043,369 | 1,940,227 | 1,890,388 |
| 2020's | 1,531,770 |
| - = No Data Reported; -- = Not Applicable; NA = Not Available; W = Withheld to avoid disclosure of individual company data. |
| Release Date: 2/9/2022 |
| Next Release Date: Suspended |