|
Download Data (XLS File) |
|
|||||
|
|||||
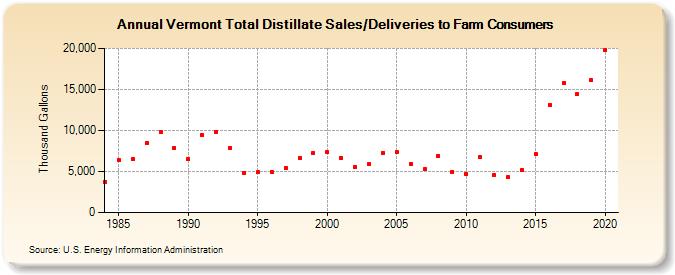
| Vermont Total Distillate Sales/Deliveries to Farm Consumers (Thousand Gallons) | |||||
| Decade | Year-0 | Year-1 | Year-2 | Year-3 | Year-4 | Year-5 | Year-6 | Year-7 | Year-8 | Year-9 |
|---|---|---|---|---|---|---|---|---|---|---|
| 1980's | 3,757 | 6,377 | 6,473 | 8,498 | 9,868 | 7,876 | ||||
| 1990's | 6,501 | 9,504 | 9,863 | 7,872 | 4,842 | 4,906 | 4,957 | 5,460 | 6,620 | 7,258 |
| 2000's | 7,349 | 6,706 | 5,592 | 5,910 | 7,297 | 7,373 | 5,954 | 5,301 | 6,951 | 4,925 |
| 2010's | 4,704 | 6,797 | 4,589 | 4,356 | 5,238 | 7,135 | 13,134 | 15,814 | 14,435 | 16,130 |
| 2020's | 19,767 |
| - = No Data Reported; -- = Not Applicable; NA = Not Available; W = Withheld to avoid disclosure of individual company data. |
| Release Date: 2/9/2022 |
| Next Release Date: Suspended |