|
Download Data (XLS File) |
|
|||||
|
|||||
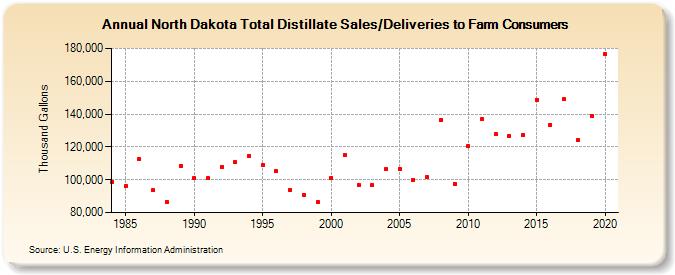
| North Dakota Total Distillate Sales/Deliveries to Farm Consumers (Thousand Gallons) | |||||
| Decade | Year-0 | Year-1 | Year-2 | Year-3 | Year-4 | Year-5 | Year-6 | Year-7 | Year-8 | Year-9 |
|---|---|---|---|---|---|---|---|---|---|---|
| 1980's | 98,666 | 96,316 | 112,619 | 93,544 | 86,453 | 108,306 | ||||
| 1990's | 100,764 | 100,834 | 107,954 | 110,586 | 114,473 | 108,785 | 105,271 | 93,925 | 90,760 | 86,362 |
| 2000's | 101,285 | 115,070 | 97,073 | 96,665 | 106,496 | 106,813 | 99,915 | 101,404 | 136,659 | 97,679 |
| 2010's | 120,410 | 136,741 | 127,762 | 126,824 | 127,413 | 148,584 | 133,463 | 148,916 | 124,134 | 138,993 |
| 2020's | 176,592 |
| - = No Data Reported; -- = Not Applicable; NA = Not Available; W = Withheld to avoid disclosure of individual company data. |
| Release Date: 2/9/2022 |
| Next Release Date: Suspended |